Data Science Portfolio

Explore my work in data analysis, dashboard development, and machine learning innovations.

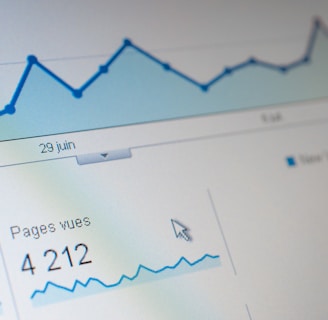
A computer screen displaying a data analytics dashboard with graphs and charts. A blue line graph shows fluctuations in data over time, and a section highlights the number of page views. A pie chart is partially visible, indicating a breakdown of different data elements.

My Projects

Explore my work in data analysis and machine learning.

A computer screen displaying analytics dashboards with various charts, including a line graph on the left and a cohort analysis table on the right. The table is populated with different shades of blue, indicating varying levels of user activity over several weeks. Text labels and numbers detail user retention statistics.
Descriptive Analysis

Insights from large-scale medical data using statistical methods.

A laptop with an open screen displaying dashboard analytics featuring charts, graphs, and numerical data related to sales and subscriptions. The interface is predominantly dark-themed with sections highlighting key performance metrics. The device shown is a MacBook Pro, indicated by the keyboard layout and branding.
Statistical Tests

Conducted various tests to validate data-driven hypotheses.

A computer screen displaying a coding interface with Python code related to machine learning. The code imports libraries like sklearn and deals with model metrics such as precision and recall. A classification report is shown along with a section titled 'Different meta model trained' listing various models like DT, RF, LR, and XGB. Below, there is code for tuning an XGB model using GridSearchCV.
A laptop displaying a dashboard with various graphs, charts, and numeric data. The screen is partially visible, showcasing sections with line graphs, financial figures, and small images. The background is blurred with a prominent red light creating a warm ambiance.
Regression Analysis

Developed models to predict outcomes based on data.

Dashboard Development

Created interactive dashboards for visualizing complex data.

Work Experience

I have over 5 years of experience in data analysis and machine learning.

Expertise in dashboard development.

Experience

Data Scientist Role

Medvision AG

2018 - 2020

Contributed to data analysis and dashboard development for medical projects.

Data Analyst Role

Divergent Technologies

2016 - 2018

Focused on statistical tests and regression analysis for various projects.

A digital screen displaying analytical data with line graphs, histograms, and numerical values. The data is presented in a user-friendly interface with different shades of blue used to distinguish various elements.

Data Science Solutions

Offering expert data analysis, dashboard development, and machine learning services tailored to your needs.

Interactive Dashboards

Create insightful dashboards for medical data analysis, enabling informed decision-making and enhanced performance.

A digital dashboard displaying various analytics charts and graphs. There is a line graph showing user engagement over time on the left, a section with total revenue marked as $74K, and bar charts illustrating user statistics by region. The central section highlights users in the last 30 minutes, focusing on different countries such as the United States, Canada, India, Pakistan, and Brazil.
Statistical Analysis

Conduct comprehensive statistical tests and regression analysis to uncover patterns and insights in your data.

Research Publications

Explore published research on anomaly detection and advanced data analysis techniques for cutting-edge insights.
A digital dashboard displays metrics related to web performance. Graphs show detailed statistics such as total clicks, total impressions, average click-through rate (CTR), and average position over time. The chart utilizes various colors to distinguish different data sets, and the interface features tabs labeled 'QUERIES', 'PAGES', 'COUNTRIES', 'DEVICES', and 'SEARCH APPEARANCE'.
A computer screen displaying an analytics dashboard with metrics such as event activity, showing a current value of 4.7k for today's activity. There are graphs indicating trends and peaks in the data, as well as labels for different types of events.

Sakhawat's expertise in data analysis transformed our project outcomes significantly. Highly recommended for data-driven insights.

John Doe

A digital chart display featuring a green line graph against a dark background, with data units labeled in white text. The line graph suggests an analysis of data volume, with sharp peaks and valleys. The lower portion of the graph is highlighted in red, indicating critical data points or alerts.
A laptop displaying a financial dashboard with various stock market graphs and data. The screen shows different stock indices and their performance, including line charts and a bar chart for market overview. The laptop is placed on a light-colored table, and a gray sofa is visible in the background.

★★★★★